What is PsyMaptic?

PsyMaptic is an open-access prediction tool which forecasts the expected level of need for Early Intervention in Psychosis care in England between 2019-2025. It has been developed by a team of researchers, led from UCL, to predict need for EIP care up to 2025 to inform NHS England’s Long Term Plan (NHS England, 2019) and Mental Health Implementation plan. Predictions are provided at CCG and national levels, and for broad sociodemographic groups.
Predictions are based on the number of new (incident) cases which are expected to occur in a given population each year. The PsyMaptic tool provides prediction data at four different levels, corresponding to typical clinical stages encountered in typical EIP care models in England:
- Referred cases: people who are referred to EIP services for “suspected psychosis”
- Assessed cases: referrals who are assessed by EIP services for possible acceptance onto an EIP caseload for treatment
- Treated cases: assessed cases who meet EIP entry criteria and commence treatment for psychosis
- Probable FEP cases: treated cases who we expect to meet full ICD-10 criteria for a first episode of a psychotic disorder
Background

Early Intervention in Psychosis [EIP] services were launched nationally in England in 2002 by the NHS and Department of Health (Department of Health, 2001). They were initially designed to provide a multidisciplinary package of care for people aged 14-35 years old (expanded to 14-65 in 2016) experiencing their first episode of psychosis.
EIP services are predicated on evidence that suggests that a longer duration of untreated psychosis results in worse mental, physical and social outcomes for people who experience psychosis (Marshall et al, 2005). By intervening as early as possible after the first episode, the intention is that these outcomes would be less severe for people experiencing psychosis.
When people are accepted for treatment for first episode psychosis (FEP) in EIP services, they are typically offered a broad, multidisciplinary package of care for up to three years, as recommended in current NICE guidelines (NICE, 2016). They are assigned a dedicated care-coordinator to organise their care needs, which may include pharmacological intervention, psychological therapies, physical health checks, family therapy and supported employment (or education) amongst other offerings.
 Evidence suggests that when EIP services achieve fidelity to this model, they lead to beneficial outcomes for people experiencing FEP for as long as the intervention is sustained (Correll at al, 2018; Randall et al, 2015; Chan et al, 2019). They are also liked by service users (Lester et al, 2012) and are cost-effective (Aceituno et al, 2019) as a result of reduced relapses and readmissions to the healthcare pathway later on.
Provision of effective and cost-effective care for psychosis (or any health outcome) must also be underpinned by precise estimates of likely need for care in different populations, especially where underlying risk varies according to known factors in the population, such as age, sex, ethnicity or socioeconomic deprivation. This public mental health approach is increasingly seen as a vital component of evidence-based health care (McGrath et al, 2018; Malla & McGorry, 2019), and allows policymakers and service providers to adequately resource services based on local need, a core aspiration of pragmatic, evidence-based public mental health.
When EIP services were first deployed nationally in England in 2002, Department of Health guidance acknowledged this issue (Department of Health, 2001), but gave no practical advice to care providers as to how to implement this:
Ideally each Early Intervention Service should manage 150 new cases per year…for a population of around 1 million people. An understanding of local epidemiology is needed as the size of the population covered will depend on a number of different factors…
PsyMaptic seeks to address this gap, by using empirical knowledge from high-quality epidemiological studies of the incidence of psychotic disorders, to provide policymakers, service providers, Clinical Commissioning Groups and other relevant stakeholders with information at the predicted number of new cases we would expect to occur in different local populations, based on their precise characteristics.
In 2016, NHS guidelines for EIP services in England (National Institute for Health and Care Excellence, 2015) were given a major update as part of the joint NHS and Department of Health’s Five Year Forward View for Mental Health (Independent Mental Health Task Force, 2016). This enshrined certain guarantees in EIP care into law as part of the NHS Access and Waiting Time Standard for Early Intervention in Psychosis services, including:
…that, from 1 April 2016 more than 50% of people experiencing first episode psychosis will be treated with a NICE-approved care package within two weeks of referral. The standard is targeted at people aged 14-65.
and Waiting Time Standard: Guidance, 2016
Version 0.5 of PsyMaptic, published in 2013 (Kirkbride et al, 2013) and updated to Version 1.1 in 2014 (Kirkbride, 2015), was included as part of this guidance document, and used to underpin Health Education England’s Workforce Calculator to support local decision-making and resourcing for EIP services. You can read more about the impact of our work here.
Nonetheless, as time has passed, there has been an increasing need to update the modelling and data that underpins the PsyMaptic tool, which we have now done in Version 2. You can read more about this in the next section, “Rationale”.
Rationale
Version 1.1 of PsyMaptic was launched in 2014 (Kirkbride, 2015), and used empirical epidemiological data from two major incidence studies of first episode psychosis conducted in England in the late 1990s. These were the Aetiology and Ethnicity in Schizophrenia and Other Psychoses (ÆSOP) study, based in South London, Nottinghamshire and Bristol (Kirkbride et al, 2006), and the East London First Episode Psychosis (ELFEP) study (Kirkbride et al, 2008).
 In Version 1.1 of PsyMaptic (Kirkbride, 2015), data from these regions was used to predict the expected number of FEP cases in the at-risk population (identified from the 2011 Census of Great Britain) in a third region, East Anglia (Kirkbride et al, 2017). A statistical model which included age group, sex, an age-sex interaction term, major ethnic group, and lower-tier Local Authority level population density and extent of deprivation provided the best fit to the observed number of FEP cases which presented to EIP services, aged 16-35 years old, in this new region between 2009-2013. You can read more about the full methodology for PsyMaptic version 1.1 in these publications (Kirkbride et al, 2013; Kirkbride, 2015). We then used this model to predict expected new cases in all lower-tier Local Authorities throughout England and Wales, for ages 16-64 years old. In 2019, we officially deprecated use of Version 1.1 and lower of this model.
While this model provided stakeholders with empirically-based predictions of local need, version 1 of PsyMaptic had several inherent limitations, including:
- Based on a static (i.e. fixed) denominator population from the 2011 Census
- Accounted for a limited number of potential covariates (risk factors)
- Measured area-level influences (deprivation, population density) at very broad Local Authority areas
- Based solely on empirical epidemiology (ÆSOP, ELFEP) of psychosis incidence preceding the national introduction of EIP services in England in 2002
- Only externally validated in people aged 16-35 years old, not 16-64 years old
- Only externally validated in one region of England (East Anglia)
- Limited to predictions of expected FEP meeting ICD-10 criteria for psychotic disorders (F10-33) (see World Health Organisation site for details) and not the additional need for care and resourcing arising from the need to assess, triage and/or treat people referred to EIP services with “suspected psychosis”.
To address these limitations, we updated our modelling approach to produce the current (Version 2.0) PsyMaptic predictions. We brought together a collaborative, interdisciplinary team of internationally-recognised experts in biostatistics, epidemiology, public mental health, EIP healthcare provision and demography (meet Our Team) to overhaul our methodology using more advanced methods to make more fine-grained and long-term predictions of psychosis need in England. We engaged with NHS England and Public Health England to help validate these new prediction models. You can read more about the methodology in the next sections.
Methodology
The complete, peer-reviewed methodology can be found in our published paper in the British Journal of Psychiatry. Here, we provide an abridged version of that methodology.
There were 5 broad stages of PsyMaptic prediction tool development:

Click on the tabs on the left hand side to learn more about each stage of the methodology.
Development and reporting of our methodology followed the TRIPOD guidelines for prediction modelling (see our published paper for further details).
Stage 1: Input data
 We required three different types of input data to develop our prediction models:
- Epidemiological data on the incidence of psychotic disorders
- Area-level data on the social environment (i.e. deprivation)
- Population data
Epidemiological data
 Epidemiological data on the incidence of psychotic disorders were obtained and pooled from three major studies conducted in England over the past 25 years, including the ÆSOP (Kirkbride et al, 2006), ELFEP (Kirkbride et al, 2008) and SEPEA (Kirkbride et al, 2017) studies. These studies provided empirical data on the incidence of psychotic disorders (ICD-10 F10-33) in
- Southeast London, Nottinghamshire and Bristol (1997-9, ÆSOP)
- East London (1996-2000, ELFEP)
- East Anglia (2009-2012, SEPEA)
The studies included data on 1,638 people with a first episode of ICD-10 psychotic disorder in a mix of rural, suburban and urban regions, with variation in patterns of deprivation, ethnicity, age, sex and other characteristics. The studies included people aged 16-64 years old (ÆSOP, ELFEP), or 16-35 years old (SEPEA). The combined catchment area of these regions included over 2m people at-risk of disorder, contributing 4.52m person-years of time to the study.
Data were stratified by age group (16-17, 18-19, then ever 5 years until 60-64), sex and ethnic groups (White British/Irish/Gypsy/Traveller, Other White, Black Caribbean, Black African, Indian, Pakistani, Bangladeshi, Mixed ethnicities, other) at the small area level.
Area level data

We obtained small area level (electoral wards) on risk factors putatively associated with the incidence of psychotic disorders from the empirical literature. These included multiple deprivation (Indices of Deprivation; Noble et al, 2004), inequality (also estimated using Indices of Deprivation data, based on a previously developed methodology in Kirkbride et al, 2014), population density, social fragmentation and ethnic density (both the latter two variables are potential area-level indicators of social isolation). Population density, social fragmentation and ethnic density were derived from small area level Census data. At the regional level (i.e. London, East of England, East Midlands etc), we measured the prevalence of lifetime cannabis use, as reported in the Adult Psychiatric Morbidity Surveys (McManus et al, 2016).
Population data
 To develop our models and estimate incidence rates, we need to know both the number of new cases who develop psychotic disorder for the first time in a given area over a set time period, and the size of the population (without psychotic disorder) from which those cases arose. This is known as the population at-risk.
For the PsyMaptic prediction tool, we would therefore need to know the number of people without psychotic disorder, aged 16-64, in each study setting. We initially obtained our population data for the ÆSOP, ELFEP and SEPEA studies from the closest ONS Census of Great Britain to when each study was conducted (ÆSOP: 2001; SEPEA: 2011). Like the epidemiological data (see above), this data was also stratified by age group, sex and ethnic group at the small area level.
Stage 2: Model development
 In Stage 2, we developed six different models, each with a different specification (parameterization) of the risk factors identified at Stage 1. These models were suitable for the type of data (count data) under study (i.e. Poisson regression) and were fitted within a Bayesian framework.
A Bayesian framework has the advantage of allowing us to easily combine our input data (i.e. empirical data) with relevant other published data (prior knowledge) from the psychiatric, epidemiological and medical literature. Prior knowledge is fitted in a Bayesian framework in the form of prior probability distributions.
We had sufficient prior knowledge on the role of age, sex, ethnicity, deprivation and cannabis use to fit informative priors on these variables. The interested reader is referred to our published paper for full technical details.
We fitted our six Bayesian Poisson models using a statistical technique called Integrated Nested Laplace Approximation [INLA] (Rue et al, 2009, 2013) to estimate the posterior distribution around each parameter of interest in the model, based on the joint distribution of the data and the prior. We then used Monte Carlo simulation to sample from this distribution to estimate the posterior relative risk associated with each risk factor and its 95% credible interval.
The six different models we tested included different specifications of the following risk factors, based on available empirical data and prior knowledge (where available):
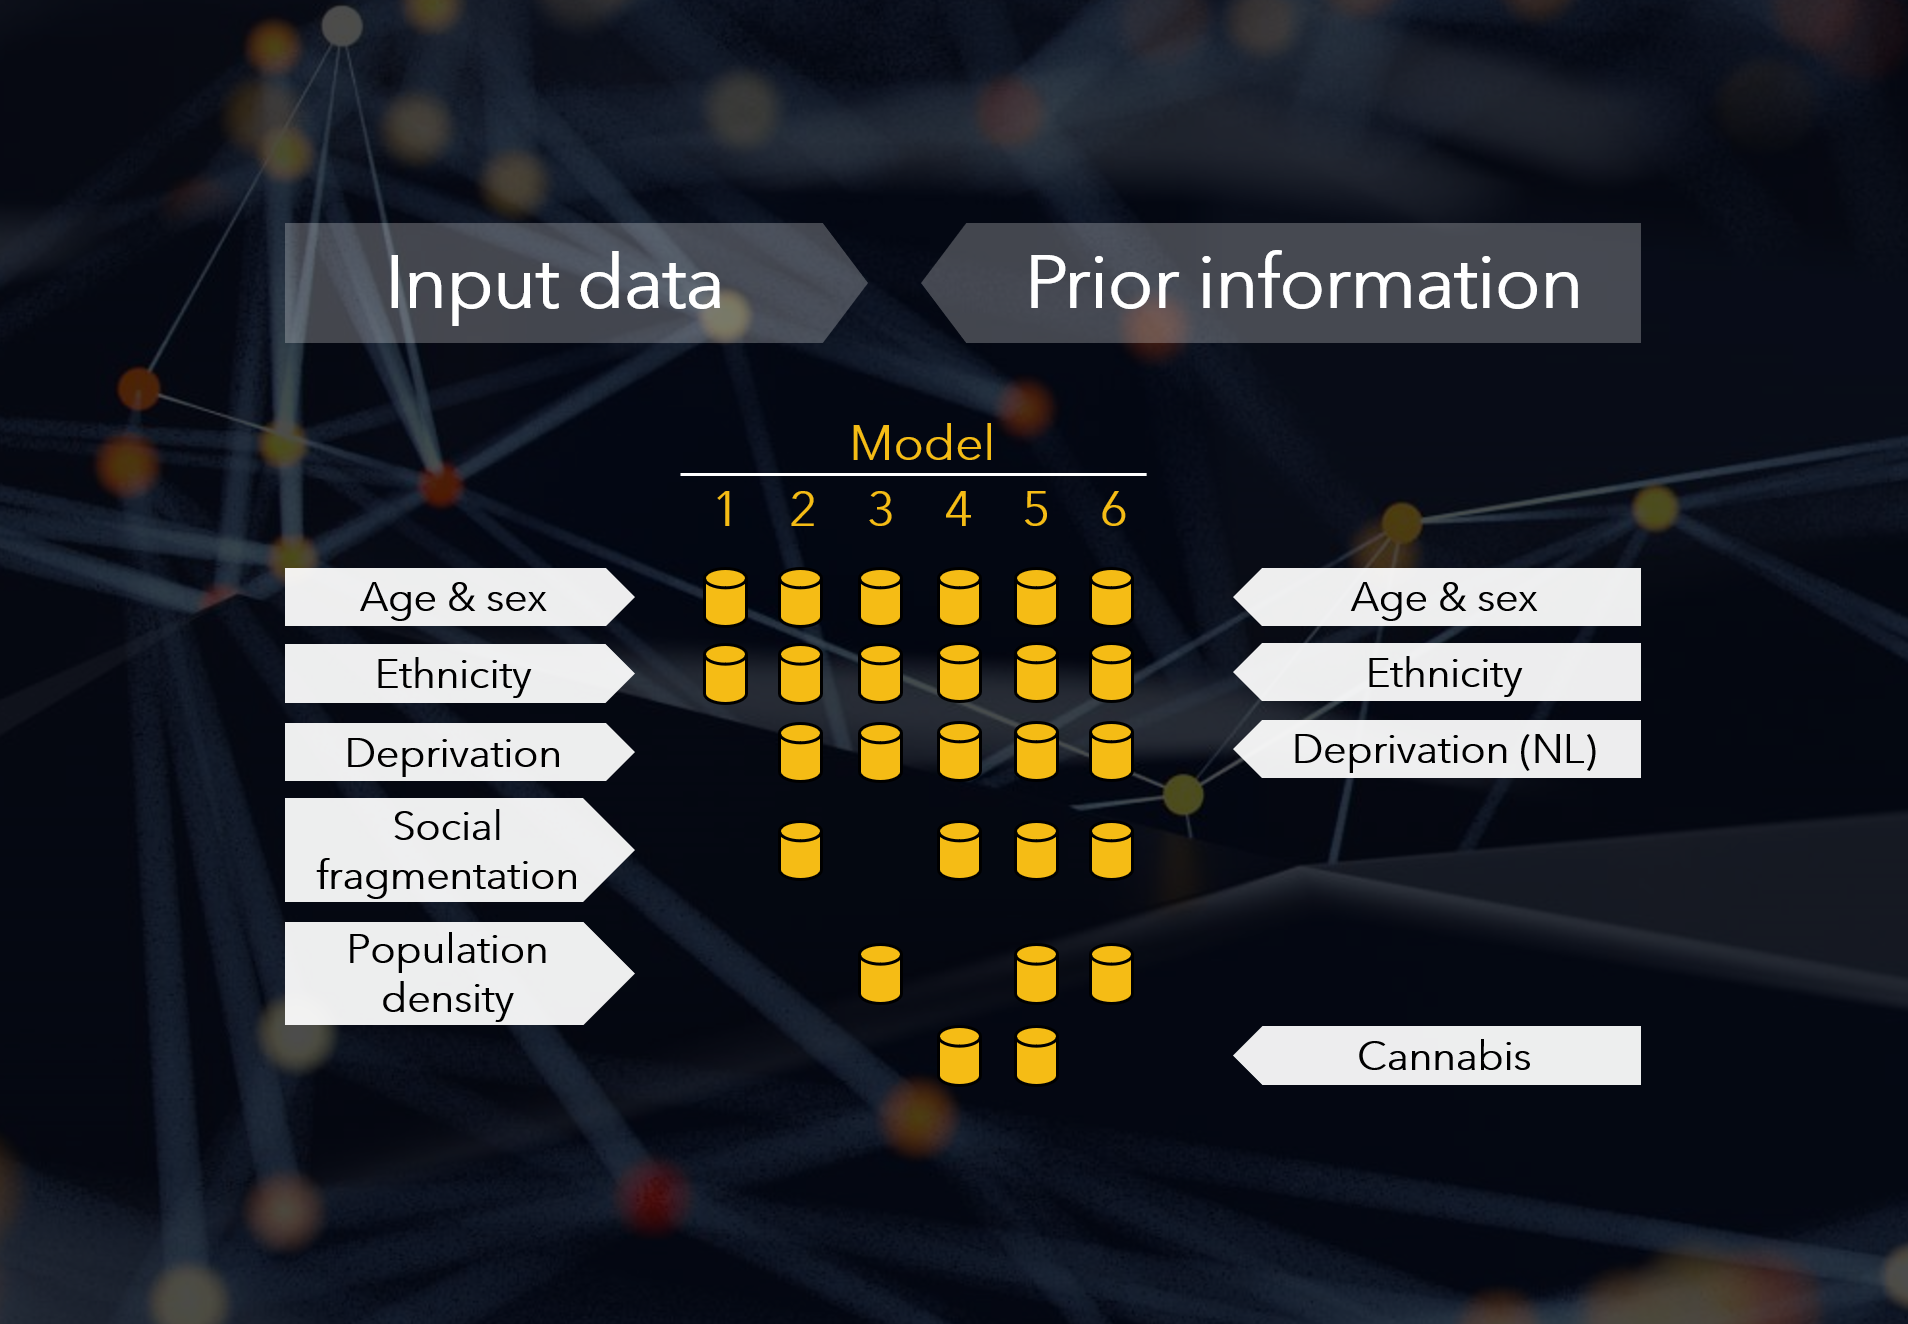
For example, Model 1 only included age, sex, their interaction and ethnicity (without area-level covariates). By contrast Model 5 included all covariates including small area population density and regional lifetime cannabis use.
Stage 3: Out-of-sample prediction
 For each of the six models developed in Stage 2, we applied the parameter estimates (risks) to the population of England at small area (electoral ward) level in 2017. This allowed us to estimate the predicted number of new cases of psychotic disorder (and accompanying uncertainty) for a given small area, based on its population size and sociodemographic structure (i.e. age-sex-ethnicity distribution) and level of deprivation, social fragmentation and cannabis use (depending on which parameters were included in each model).
The population at-risk in England for 2017 was estimated using a demographic forecasting methodology developed by one of our team (Pia Wohland; see Lomax et al, 2020, and Rees et al, 2017). Briefly, this took the estimated population at-risk for each electoral ward from the 2011 Census of Great Britain, and made adjustments for population projections based on changes in birth and death rates, and immigration and emigration (these changes were assumed to be constant at lower tier Local Authority level). The same methodology was used to make projections of the population up to 2025 at small area level for Stage 5 (Forecasting), including a Brexit scenario on immigration/emigration rates.
Area-level data for 2017 was based on the nearest temporally available data source, including the 2015 Indices of Deprivation (Ministry of Housing Communities & Local Government, n.d.) and 2014 Adult Psychiatric Morbidity Survey (McManus et al, 2016), and the 2017 population density, based on the projected population data.
We aggregated predicted cases for each small area (electoral ward) to the Clinical Commissioning Group [CCG] level along with 95% credible intervals (see the Supplemental Materials section of our published paper for full information). CCGs are autonomous, clinically-led statutory NHS bodies responsible for the planning and commissioning of health services in local areas.
Stage 4: Validation
 Each of the six candidate models developed in Stage 2, and applied to the estimated population at-risk in England in 2017 in Stage 3, produced the predicted number of new cases of psychotic disorder at electoral ward level. We aggregated these to CCG and national levels for validation purposes.
Model validation proceeded in two steps:
- Apparent (or internal) validation (i.e. the statistical fit of the models to the input data described in Stages 1 and 2), and;
- External validation to the whole of England in 2017
Internal (apparent) validation
We assessed the internal fit of the models to the data using the Deviance Information Criterion [DIC], a Bayesian parameter describing model fit, where lower scores indicated better fit, having penalized the model for complexity (the number of parameters in the model). The results were as follows:
Model 1 DIC: 11,614.04 (worst)
Model 2 DIC: 11,533.86
Model 3 DIC: 11,539.75
Model 4 DIC: 11,533.72
Model 5 DIC: 11,531.93
Model 6 DIC: 11,531.88 (best)
Model 1, fitted with individual-level covariates only (age, sex, their interaction, ethnicity) performed substantially worse than Models 2-6, whose DIC scores were generally comparable (although Model 3 performed worse than Models 2, 4-6, whose DIC scores should be regarded as sufficiently similar to be considered as providing equivalent internal fit.
External validation
We compared the predicted count of new cases of psychotic disorder generated by our models to the closest definition/estimate of the observed count of cases in England in 2017. To do so, we derived observed data from the NHS Digital data from the Mental Health Services Dataset [MHSDS].
The MHSDS (and its previous incarnations, the MHMDS and MHLDS) record routine information on all contacts with NHS mental health services each year into a dataset with a minimum set of variables to inform service provision. The dataset (as the MHMDS) was first established in 2013.
Working with partners in NHS England with expertise in interrogating these databases, we were able to identify and estimate the number of people in contact with Early Intervention Psychosis services in 2017. From this, we excluded people who had a previous contact with EIP services for suspected psychoses (i.e. between 2013-2016) to ensure our observed caseload estimates were based on new (i.e. incident) cases only.
Using the MHSDS data, we were then able to estimate new caseload sizes at four clinical stages on the pathway to EIP care:

We provide formal, detailed definitions of these clinical stages in our published paper. Briefly:
- Referred: People referred to EIP services for “suspected psychosis”;
- Assessed: People accepted for assessment (not treatment) by EIP services;
- Treated: People accepted for treatment by EIP services;
- Probable FEP: People treated by EIP services with probable first episode psychosis
Of particular note, we estimated observed probable FEP from the MHSDS by making an adjustment to the treated caseloads identified in the dataset. The treated caseload included people who may meet EIP acceptance criteria and commence a NICE-concordant package of care but who are later not found to meet ICD-10 threshold criteria for a psychotic disorder (this may include a proportion of people who present and are treated as “at-risk mental states” (ARMS), for example). Based on published empirical evidence (Kirkbride et al, 2017), we estimated observed the probable FEP caseload as 86% of all people treated by EIP services.
We compared predicted new cases of psychotic disorder (ICD-10 10-33) from our models with new observed probable FEP cases (probable ICD-10 10-33) in 2017.
For each model, we estimated the difference (error) between predicted and observed cases at the national level, and by age group, sex and ethnic group at the national level, taking into account some missing observed data on ethnicity via an imputation method (see our published paper for full details). At the CCG-level, we compared predicted and observed probable FEP caseloads by computing the correlation and root mean squared error [RMSE], two indicators of model validity. Observed and predicted caseload sizes were matched for the age range catered for by EIP services in 2017 (this varied by CCG, and included 14-35, 18-35, 18-65, 14-65).
A summary of our external validation results is given in the table below:
| Model | Covariates | Observed | Predicted (95% CrI) | Error (n, %) | Correlation (CCG) | RMSE (CCG) |
|---|---|---|---|---|---|---|
| 1 | AxSE | 8,038 | 8984 (8497-9460) | 946 (11.8%) | 0.70 | 23.6 |
| 2 | 1+D+SF | 8,038 | 8137 (7642-8637) | 99 (1.2%) | 0.74 | 21.0 |
| 3 | 1+D+PD | 8,038 | 8362 (7907-8851) | 324 (4.0%) | 0.74 | 21.6 |
| 4 | 2+C | 8,038 | 8112 (7623-8597) | 74 (0.9%) | 0.74 | 20.9 |
| 5 | 4+PD | 8,038 | 8187 (7722-8707) | 149 (1.9%) | 0.73 | 21.3 |
| 6 | 2+PD | 8,038 | 8205 (7716-8763) | 167 (2.1%) | 0.73 | 21.3 |
| Legend: AxSE – Age by Sex interaction & Ethnicity; D – Deprivation; SF – Social Fragmentation; PD – Population Density; C – Cannabis; 95%CrI – 95% Credible Interval; CCG – Clinical Commissioning Group | ||||||
| Numbers in bold indicate model with best fit | ||||||
Models 2-6 had similar validation metrics when compared with observed data by broad age group (16-35, 36-64), sex and major ethnic group (following imputation) at national level.
Overall, we selected Model 4 (age, sex, their interaction, deprivation, social fragmentation and regional lifetime cannabis use) as the model which exhibited the best internal and external validation indices across all metrics. We used this model in the PsyMaptic (version 2.0) prediction tool to forecast future need for EIP services in England.
Stage 5: Forecasting
 Our most valid model identified in Stage 4 (Model 4, see Validation tab) underpins our PsyMaptic tool (Version 2.0). We applied this model to forecast the predicted number of new cases of probable FEP in England for each year between 2017-2025. We used the population projections developed at Stage 2 (Model development tab) as the base for these predictions.
In addition to predicted new cases of probable FEP in each year, we also forecast the predicted number of new cases at every other clinical stage on the pathway to EIP service treatment.

Four Clinical Stages of Prediction
We estimated the predicted number of new people additionally referred to, assessed by and treated within EIP services based on the median ratio of referred:assessed:treated cases reported at CCG level in the observed MHSDS data reported for England in 2017 (see Prediction tab for more details).
On this website we provide prediction data from this model, as follows:
- For all four clinical stages
- For the years 2019-2025
- At national (England) or CCG levels
- Stratified by major age group (16-35, 36-64, 16-64 years), sex (male, female) and ethnic group (White British/Irish/Traveller/Gypsy, other White, Black Caribbean, Black African, Indian, Pakistani, Bangladeshi, Mixed ethnicities, other)
- As incidence counts (i.e. new caseload numbers per year) or incidence rates (i.e. new caseloads per 100,000 people at-risk per year).
PsyMaptic provides predictions of incidence (or incident) cases, expressed as either counts or rates. Please ensure you understand this terminology before using our data. Two of the most common misconceptions about the data provided by the PsyMaptic tool are:
- The difference between a count and a rate;
- The difference between incidence and prevalence
All predictions on PsyMaptic.org are accompanied by their 95% credible intervals (measures of statistical uncertainty). This uncertainty should be considered in any further use of the prediction data provided on this website, in accordance with our Disclaimer.
This data is made available for further use on this website under an Open Access agreement, free to the end user under a Creative Commons BY-SA licence (3.0), which has been approved for Free Cultural Works and consistent with Open Access and Open Data best practices.
PsyMaptic prediction data is available to use via our interactive dashboard including map visualisations, or as downloadable Excel spreadsheets from our DataStore. Data that is not readily available on this site can be commissioned via a cost-recovery model; please contact us for further information.
For technical help with using the features on this website, please see our series of user guides.
Strengths
PsyMaptic (version 2.0) overcomes several issues of its predecessor (v. 1.1), including:
 Predicting need for probable FEP as well as additional resourcing needed for people referred to, assessed by and treated within EIP services
- Predictions based on updated population projections for each year until 2025
- Predictions made at small area level (electoral wards) and aggregated to CCG and national level. Option to aggregate to any desired geography (contact us).
- Predictions available for major sociodemographic groupings. Option to aggregate to other groupings (contact us).
- Integrating available empirical data and knowledge on psychosis risk at the population level, including effects of cannabis use
- Includes empirical data from three largest epidemiological studies of FEP in England, including data collected within EIP services (SEPEA)
- Externally validated to whole of England in 2017 using routine national data
- Limited set of models tested (N=6) based on theoretical knowledge to avoid overfitting
Limitations
PsyMaptic (version 2.0) has several limitations, which should be noted, including:
 Any prediction is an estimate and contains uncertainty. Statistical uncertainty, expressed as 95% credible intervals, is provided with our predictions, but the validity of our model predictions to new areas (out-of-sample) depends on several assumptions, including the transportability of risk factors.
- Input data on psychosis incidence based on evidence from approximately 10% of electoral wards in England, covering 14.5% of CCGs.
- Our models tended to underestimate probable FEP cases in 16-35 year olds and overestimate probable FEP cases in 36-64 year olds (but had good validity for the whole age range, 16-64). Further details can be found in the published paper.
- Observed data used to validate our predictions was provided by the MHSDS in 2017, but this dataset does not provide an “off the shelf” identifier for people with a clinical diagnosis of ICD-10 psychotic disorder. The MHSDS dataset was limited to providing an estimate of people treated by EIP services, which based on empirical evidence, would include approximately 14% of false positives (people who would later not be found to meet threshold criteria for psychotic disorder). To overcome this, we adjusted the observed treated cases to estimate probable FEP.
- The treated predictions may include people meeting a definition of “at-risk mental states” [ARMS], sometimes also referred to as ultra-high risk [UHR] for psychosis or clinical high risk [CHR]. Due to the recording of data in the MHSDS it was not possible to separate out ARMS from other people in the observed treated group.
- We could not use our methodology to predict the incidence of psychotic disorders (or referred, assessed or treated numbers) for people aged 14-15 years old, for whom EIP services are also mandated to provide care. This was due to a lack of epidemiological evidence on psychosis rates in this young age group. Recent evidence from Chile (González-Valderrama et al, 2020) suggests the rate may be very low at this age. We would expect additional need generated by this age group to fall within the bounds of the credible intervals provided for the 16-35 year old age range.
- We have provided a simpler, alternative methodology to predict cases aged 14-15 year olds, but the data is experimental and has not been validated. You can download that data here.
- Our model does not predict need in people aged 65 years old, for whom EIP services in England are also mandated to provide care. Risk at this age is very low (Kirkbride et al, 2006) and we would expect additional need generated by this group to fall within the bounds of the credible intervals provided for the 36-64 year old age range.
- Our model does not predict cases in non-residential populations in England, including the homeless population and people in institutional settings (hospitals, care homes, the armed forces or prisons).
References